Grid reference
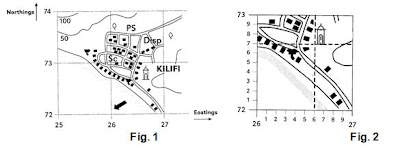 1. Always remember to read from the bottom left corner.
2. If the question ask for the four-figure grid reference or grid square of a particular building, e.g. the Hindu temple shown in Fig 1. Read the number for the easting first (from the X axis) and then the northings (from the Y axis). E.g example in Fig.1 is located in 2672
3. If the question ask for the six-figure grid reference or grid square of a particular building, e.g. the Hindu temple shown in Fig 2. Start by finding the grid square with the feature, then divide the grid square into 10 equal parts along both the northings and eastings. Place a ruler onto the bottom left corner of the feature, e.g. the Hindu temple is located at 266727. Read the number for the easting first (from the X axis) and then the northings (from the Y axis).
Direction
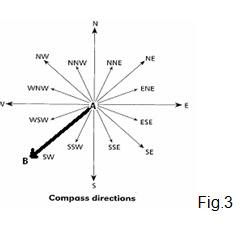 To measure the direction of one point to another, draw a straight line connecting them.
- Read the question carefully– if the question ask you the direction of B from A, then draw a + sign at A and read the direction from A.
- Draw a straight line connecting the 2 points.
- Draw a + sign at where you are taking the bearing from.
- Place the protractor at the + sign with 0° facing north and then read the bearings from the point starting from 0° (north) clockwise as shown in Fig.4.
Height 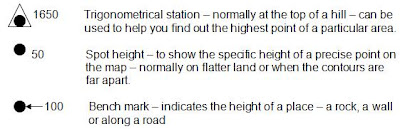 The height of a place above sea level can also be indicated by the contour lines.
Contours are imaginary lines connecting areas of the same height above sea level on a map.
The contour lines can be used to show the relief of a place such as whether the slope is gentle or steep. The spacing of the contours indicate the steepness of a slope – the closer the contours the steeper the slope and vice versa.
The height of a place above sea level can also be indicated by the contour lines.
Contours are imaginary lines connecting areas of the same height above sea level on a map.
The contour lines can be used to show the relief of a place such as whether the slope is gentle or steep. The spacing of the contours indicate the steepness of a slope – the closer the contours the steeper the slope and vice versa.
a) valley – associated with rivers, tend to be V-shaped and narrow in the upper course, broader in the lower course
b) plateau – elevated land with flat top and steep sides
c) escarpment – continuous line of steep slope at the edge of a ridge or plateau.Guide to describing reliefGive the average height ( or the range of height) of the relief of the area and state the height of the highest point.
Describe the relief of the area:
(a) state whether it is mountainous or hilly or whether it is part of a plateau. Point out and describe any relief feature that stands out in the area and state its location on the map.
(b) Describe the slopes in the area. States whether they are concave. Convex, uniform, steep or gently sloping.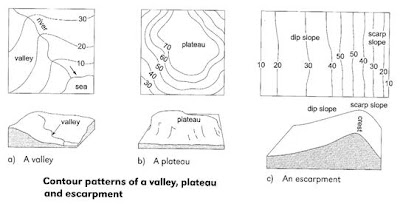 Example of how you can describe relief:
The height of the area ranges from below 10 metres near to the coast to 548 metres in grid square 8483.
The main relief feature is T Mountain which is in the western part of the area. As the mountain extends to the south-east, it becomes narrower and its height decreases. This part of the mountain has two peaks of heights about 240 metres in grid square 8582 and about 110 metres in grid square 8682. This part of the mountain also has two spurs from grid square 8583 to 8683 extending from south-west to north-east.
The contours of T Mountain are very close together in the area west of easting 85. This indicates that the slopes are steep. The spacing of the contours on the eastern side of the mountain is wider. The slopes here are therefore less steep.
Steps taken to measure gradient
Identify the two points which the measurement is taken from and the height above sea level for the two points. You can either refer to the spot heights, the bench marks or the contour lines.
Calculate the height difference (vertical distance) of the two points.
Convert the height to the same unit of measurement as for horizontal distance if necessary e.g. 3.048 feet = 1metre
Measure the distance of the 2 points on the map. Convert to actual distance by referring to the line scale or using the map scale ie. 1: 50,000 means 1 cm on the map represents 500m in actual distance.
Gradient is expressed in ratio form – vertical distance: horizontal distance ie. 1: 30 - which means for every 1 metre increase in vertical distance, there is an increase of 30 metres in horizontal distance.
Evidence of water supply
Reservoir
Pump house
Pipeline
Settlement Pattern
a) Dispersed – houses far apart – areas with low economic development e.g. normadic herding, smallholdings
b) Linear – arranged in a line, usually along a mode of transport ( rail, road) or waterway (river, coast) to take advantage of the accessibility and resources.
c) Nucleated – concentration of buildings or houses – usually at road junctions or centers of economic activities ( e.g. community or village with facilities like school and shops)
Choice of site for the location of airport,
plantation, settlement etc.
Availability of large area
of flat land, ability to expand, very accessible e.g. near to rail or roads,
availability of services or resources – remember to look closely at the map
symbols on the map and refer to the legend of the map.
Examples of questions on
land use
Suggest why the Airport/Air landing strip was built at ______________.
- Large area of flat land as indicated by absence of contour lines– necessary for the runway
- Roads linking it to the main town - accessible
- Away from settlement as tall buildings can be a hazard to planes taking off or landing. There is also noise pollution from airport.
|
Describe the pattern and location of land
use.
The
towns are located along the coast on low relief, as seen between Easting ______and
____, and Northing _______and __________.
Agricultural
activities are generally located on low relief near sources of water such as
rivers, as evident in grid square ________.
The
area could possibly be a tourist area as the towns are located near the beach
and corals. The tourists can participate in water sports near the beach and can
go for snorkelling or diving near to corals.
With the use of evidences from the map, explain why tourist industry is
the most important economic activity for the people living in the area.
- Located
near to natural attractions such as gorges,waterfalls, beach, coral reefs etc which may have attracted many tourists
- Availability of heritage sites such as fort, ruins, temple and other places of interest indicated on the map
- Availability of activities for tourists e.g. watersports such as snorkelling, scuba diving, swimming near to the beach, cruising down the river etc
- Many facilities such as hotels, chalets, casino, golf course etc can be found
which cater for the tourists
- Lack of
cultivated area which shows that cultivation is not an important
economic activity in Victoria Fall
- Linked
by railway and roads or presences of airport/air landing strips, jetties, harbour etc
- Presence of customs
|
Remember to quote the grid reference for the above!
Describe and explain the relationship
between the relief, and the transport and communication infrastructure.
The transport and
communication infrastructure seen in the topographical map extract consists of
roads and footpaths. These are located on flat land. As the roads and footpaths
connect and service settlements and plots of cultivation, as seen between
Easting _____and ___and Northing ____ and ______, they tend to be on low
relief. This is because the low relief makes it easier for the roads to be
constructed.
Describe and account for
the location of the area used for food production in the map.
The main food production is the growing of
sugar-cane to be made into sugar as shown by the presence of large area under
sugar plantation and the presence of sugar mill in grid square ________.
The sugar plantations fill most of the area shown. This is probably because
of the relatively low relief and the gentle slopes of the area which make these
areas accessible. No sugar plantations are found in areas of high relief and
steep slopes found in grid squares ______and ______.
The roads are important for the transportation of
sugar-cane to other settlements for refining or for sale. It also allows
workers to be transported from their homes to the plantations and back. They are generally located on areas of low
relief and gentle slopes because these conditions make the infrastructure easy
to construct.
E.g Map practice on Port Antonio, Jamaica
Describe the distribution of agricultural
activities in the part of the map south of Northing 66 and west of Easting
10.
- ·
Most of the agricultural areas are found at lower
altitudes below 200 metres / flatter land along the River Grande where the
contour lines are spaced further apart.
- ·
The banana plantations tend to be found on the
western bank of River Grande north of northing 63, and to the eastern bank
south of northing 63.
- ·
Mixed or scattered cultivations occupy most of the
areas east of the Class C road as well as on the slope of Samba Hill west of
easting 03 where the land is more gently sloping and a number of
watercourse/river provide water for irrigation.
- ·
Agricultural land is generally not found to the
west of Easting 07 and south of northing 63 which is dominated by woodland,
trees and scrub instead.
Port Antonio is one of the popular tourist
areas in Jamaica. What are two possible reasons why tourists choose to visit
this area? Provide evidence from the map to support your answer.
Tourists are attracted to visit Port Antonio
due to
- The
place is accessible as there is presence of roads and jetties which made the
place accessible.
- The
place has natural attractions such as the Ship Head and Bryans Bay, coral reefs
and forest. They can view the scenic beauty of the place and relax.
- Places
of interest such as Nonsuch caves at 1067 or the Fort George at 0770
- Water
sports such as snorkelling
- There
are facilities such as hotel (e.g. at 133691)
for the tourist.
Describe
the impacts of tourism on people living in Port Antonio with reference to map
evidence.
- Generate
income and jobs for the people e.g. those working in the hotels at cocoa walk
bay 133691 and salt creek bay (153688) or as guide for snorkelling, scuba
diving etc
- Development
of the infrastructure which can also benefit the locals e.g. class A roads,
rail, jetty and harbour
- Preservation
of heritage site e.g. Fort George in 0770 which is a place of interest on the
map
- However
can also bring negative impacts such as destruction to the coral reefs which
are sensitive to pollution


